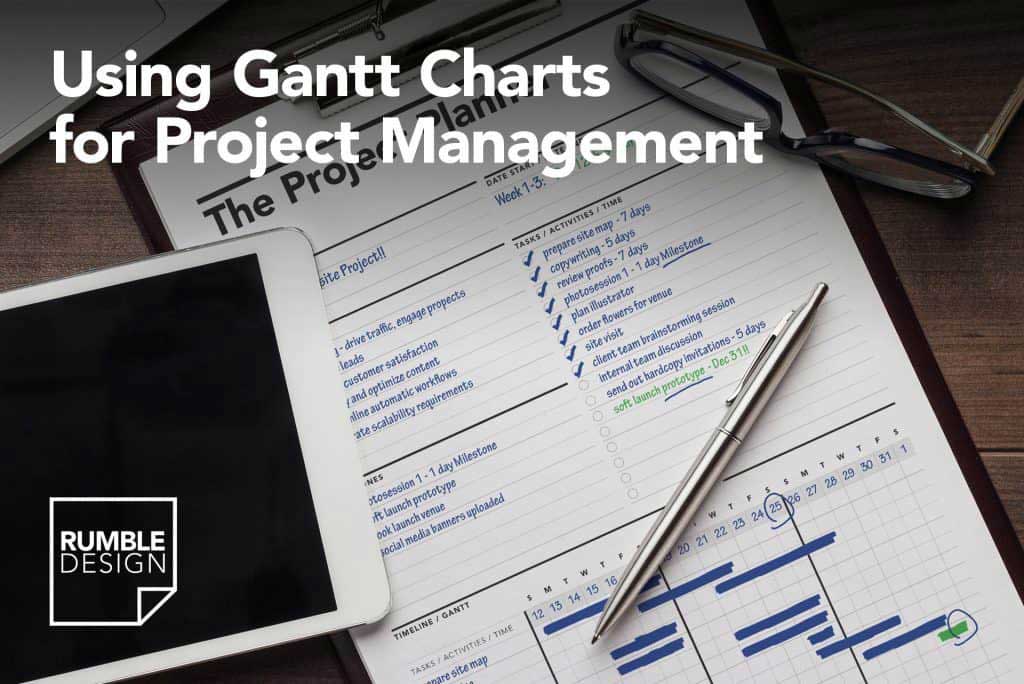
To successfully complete a project, use a project planner. In project management, you must control a large number of activities and ensure that they’re finished on time, for this to happen, a lot of planning has to take place. This usually involves many tasks working together and sequentially, and if not organised, will affect the rest of the project, leading to late deliveries and increased costs!
During the project planning process, it is essential to list all the activities required for project completion, and know with certainty when each action needs to be completed. Gantt charts convey this information visually and beautifully. They outline from an overview of all the tasks involved in a project, in the order with which they will be performed and shown with a timescale. On a Gantt chart you can easily see:
• The start date of the project
• What the project tasks are
• Who is working on each task
• When tasks start and finish
• Duration of each task
• See relationships between tasks
• The finish date of the project.
When creating a Gantt chart, you need to go through all the tasks involved in your project mentally. This detailed thinking helps you ensure that the schedule is workable and that all the little steps that help you achieve the final goal are accounted for, it also gives you an opportunity to prepare for potential problems before you start.
HOW TO CREATE A GANTT CHART
Identify Essential Tasks
In developing a Gantt chart, it is essential that you know all of the processes involved. Start by listing out all activities involved in the projects. Then, for each individual task, take note of its earliest start date and estimated duration. This means that you will need to use a flow chart or arrow chart to go through each of the steps required to make sure the project is completed.
Tip: Creating the chart itself can be a little tricky, especially if you are doing it from scratch. Use a Project Planner Worksheet that contains horizontal axis to indicate the time (the time can be broken down into days or weeks depending on which scale is the most appropriate for your plan) then on the left side of the page add each of the tasks as well as the milestones.

Identify Task Relationships
The Gantt chart shows the relationship between the tasks in a project. Some tasks will need to be completed before you can start another one (Finish-to-Start), and others can’t end until preceding ones have ended. The dependent activities are called sequential or linear tasks. While the other tasks are called parallel tasks (meaning they can be done at the same time as other tasks).
Tip: Identify which of your project’s tasks are parallel, and which are sequential. In a situation when tasks are dependent on others, simply note the relationship between them. This will give you a better understanding of how to organise your project and will help during the scheduling processes.

Input Activities into Software or a Printable Template
You can draw your charts by hand with a project planner worksheet or use specialised software, such as Gantto, Ganttpro, or Microsoft Project.
Tip: If working in teams, consider using cloud-based tools so that you and your team can access the document simultaneously, from any location.
Chart Your Progress
As your project moves along, it will evolve. Always ensure to update your chart to reflect changes on the project as they occur. This will go a long way to help you keep your plans, your team, and your stakeholders up to date.
Go ahead and try using a Gantt chart in your project planning, I absolutely believe that it will help you organise those complex projects and bring calm back to your day!
Happy Planning!


